For the past year and half, many Singaporeans have come to expect the government’s daily COVID-19 case update at around 4 PM. Delays tend to mean bad news, as most recently shown yesterday, when the update was delayed by around two hours and revealed Singapore’s worst community transmission numbers ever (88 cases).
So I couldn’t help thinking: can we, the public, predict case numbers from the delay alone? In cryptanalysis, this is called a side channel, meaning we’re extracting information not from the message itself, but from metadata like timing.
Alas, the Ministry of Health does not timestamp its press releases, but fortunately avid Redditors do, reloading the page on repeat until the update shows up and immediately posting it for that sweet, sweet karma. Using the Reddit API, I quickly hacked together a simple Python script to extract afternoon-ish posts of moh.gov.sg links to /r/singapore and spit out the stats of how many local cases there were that day and how delayed the update was. After a little massaging by hand to account for inconsistent titles etc, I had a Google Sheet of 46 posts between My and July 2021. Here’s a graph comparing cases vs delays, with cases in blue and minutes elapsed after 3 PM in red:
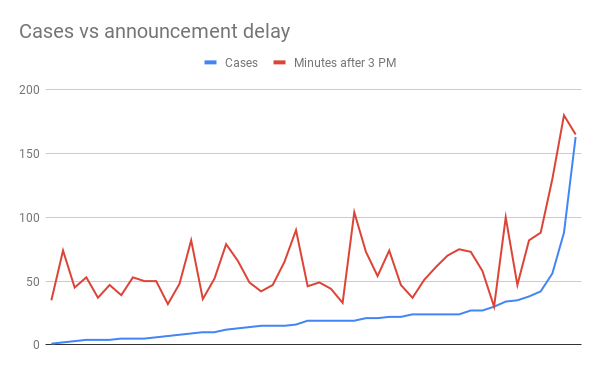
Cases per day were sorted from least on the left to most on the right, and while the corresponding minutes of delay graph is spiky, the correlation particularly on the right side is clear enough even to the naked eye. Indeed, applying statistics 101, the Pearson correlation coefficient is 0.77 across the whole set (n=46), or 0.81 for days with over 20 cases (n=19), where 0 means no correlation and 1 means perfect correlation.
Applying linear regression via the FORECAST() function, we can now come up with a thoroughly unscientific prediction of cases per day based on the minutes of delay:
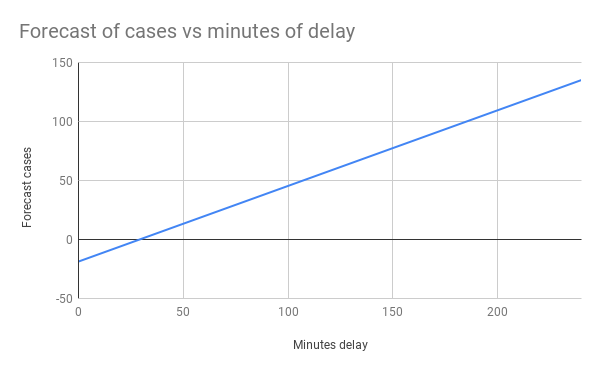
In short, a press release at 4 PM sharp averages out to 20 cases, and every hour of delay after that adds around 38 cases to the tally. Selecting points at one-hour intervals:
| Press release time | Minutes of delay | Forecast number of cases |
| 3:00 PM | 0 | -19 |
| 4:00 PM | 60 | 20 |
| 5:00 PM | 120 | 58 |
| 6:00 PM | 180 | 97 |
| 7:00 PM | 240 | 135 |
Why negative at 3 PM? Because the earliest time recorded in this sample was 3:30 PM. Here’s hoping we don’t need to add any more rows to the table.
Disclaimer: This is all wildly extrapolative and inaccurate, uses a poorly controlled sample, relies on the whims of random Internet posters, and doesn’t account for how unlinked, dormitory or imported cases may impact the delays. Short the STI or buy 4D at your own risk, and please don’t have a heart attack if some overworked social media person at MOH collapses from exhaustion and doesn’t get around to posting the zero-cases update until 8 PM.
Last revised on 19 July 2021.
